
01
Why this, why now
Two things happened this year that ought to be incompatible, and reconciling them is what this dossier is for.
The first is that inference got dramatically cheaper. According to Goldman Sachs Research, semiconductor suppliers are delivering cost reductions of 60 to 70 percent per year per token. That is a rate of decline that would flatter almost any other technology.
The second is that companies started running out of money. Uber's chief technology officer told staff in the spring that four months of use had consumed what was meant to last twelve, and the company imposed a cap of $1,500 per employee per month on agentic coding tools. At Meta, an internal dashboard tracking token consumption across more than 85,000 employees showed the heaviest user averaging 281 billion tokens over thirty days. Microsoft withdrew developer access to an external coding agent in May and moved its engineers onto an in-house tool, which it framed as consolidation and which landed at the end of a fiscal year.
Both facts are correct. Reconciling them is straightforward once the unit is named properly, and almost nobody names it properly.
You do not buy tokens. You buy finished tasks. The number of tokens between the two is set by three things: how efficiently the model reasons, how much context the harness re-sends on every turn, and how large a budget you allow. We call these the three multipliers, and the third has a property the other two do not. It also determines how capable the system is. A cheaper agent is a less capable agent, measurably and predictably, which means cost and capability are the same dial rather than a trade-off to be negotiated.
That has an awkward consequence for every capability claim you have been shown. In August the UK AI Security Institute put it in one sentence: agent capability cannot be interpreted without the compute budget used to estimate it. Almost no vendor publishes that budget.
Timeline
- Mar 2026 · The New York Times describes "tokenmaxxing" among engineers at large technology firms.
- Apr 2026 · Meta's internal consumption dashboard surfaces; the heaviest user is averaging 281 billion tokens over thirty days.
- Apr-May 2026 · Uber discloses internally that four months of use consumed its twelve-month AI budget, and caps spending at $1,500 per employee per month.
- May 2026 · Microsoft withdraws developer access to an external coding agent, moving engineers to an in-house tool by 30 June.
- Jul 2026 · Databricks publishes benchmark results from its own multi-million-line codebase showing that cheaper per token routinely means more expensive per task.
- Aug 2026 · AISI publishes work showing that measured agent capability moves by roughly a quarter depending purely on the token budget allowed.
02
Contents
1. The unit you are quoted and the unit you consume
2. The first multiplier: reasoning efficiency
3. The second multiplier: what the harness re-sends
4. The third multiplier: the budget, which is also the capability
5. Why the bill rises while the price falls
6. What the rationing looks like from inside
7. The measurement problem this creates for buyers
8. What a contract should say and mostly does not
9. Where the numbers in this field come from
10. What we would do on Monday
11. Where we could be wrong
12. What we are watching
13. Verification and sources
03
1. The unit you are quoted and the unit you consume
A chatbot answers once. An agent plans, calls a tool, reads the result, notices it was wrong, tries again, and repeats until it is done or until you stop it. That loop is the entire commercial difference between the two, and it is why a single request to an agent can consume ten or fifty times what the same request costs a chat interface.
Goldman Sachs Research projects that token consumption multiplies roughly 24-fold by 2030, reaching something in the region of 120 quadrillion tokens a month. That is a projection rather than a measurement, and the shape matters more than the figure. Set it beside a unit cost falling 60 to 70 percent a year and we would rather perform the arithmetic than assert it, because the result is counter-intuitive enough that people assume it must be wrong.
Take the friendlier end of the price decline first. A cost falling 60 percent a year multiplies by 0.4 annually, so over the four years to 2030 it lands at roughly 2.6 percent of today's price, which is a fall of a factor of about 39. Against that, volume rises by a factor of 24. Multiply the two and the bill lands at around 60 percent of today's: genuinely lower, and the optimistic case is real.
Now take the steeper decline and a shorter horizon, which is the situation a finance director is actually in. Nobody budgets to 2030; they budget for next year. Over a single year a 65 percent decline leaves the unit price at 35 percent of today's. For the bill to stay flat, volume has to rise less than 2.9-fold. Uber's consumption ran roughly three times its plan inside four months. At that rate the price decline is not a saving. It is a discount on an overrun, and it arrives twelve months after the invoice.
That is the shape of the problem: the price falls on a multi-year curve and the volume rises on a quarterly one, and budgets are annual.
There is a historical parallel here, and we would build it properly rather than name-drop it, because the mechanism it describes is the one operating on these bills.
In 1865 the economist William Stanley Jevons published *The Coal Question*, in which he examined an argument that seemed obvious to his contemporaries: that James Watt's more efficient steam engine, by extracting more work from every ton of coal, would slow Britain's consumption of it. Jevons showed the opposite had happened. Efficiency had lowered the cost of steam power, cheap steam power had made whole categories of enterprise viable that had not been viable before, and national coal consumption had risen sharply. His point was not that efficiency is bad. It was that efficiency changes what people attempt, and that the change in behaviour routinely swamps the saving per unit.
The distance between coal in 1865 and inference in 2026 is obvious, and the mechanism survives it intact. A capability that costs a tenth of what it cost last year does not get used at last year's volume for a tenth of the money. It gets pointed at problems nobody would previously have paid a person to solve, by people who were never in the budget line, at volumes nobody modelled.
What is new is the speed. Jevons was describing a shift across decades. This one is arriving inside a fiscal year, which is why the finance function is meeting it as a surprise rather than as a trend.
04
2. The first multiplier: reasoning efficiency
The cleanest evidence we have found on this comes from Databricks, which benchmarked coding agents against its own multi-million-line production codebase in July and published the numbers.
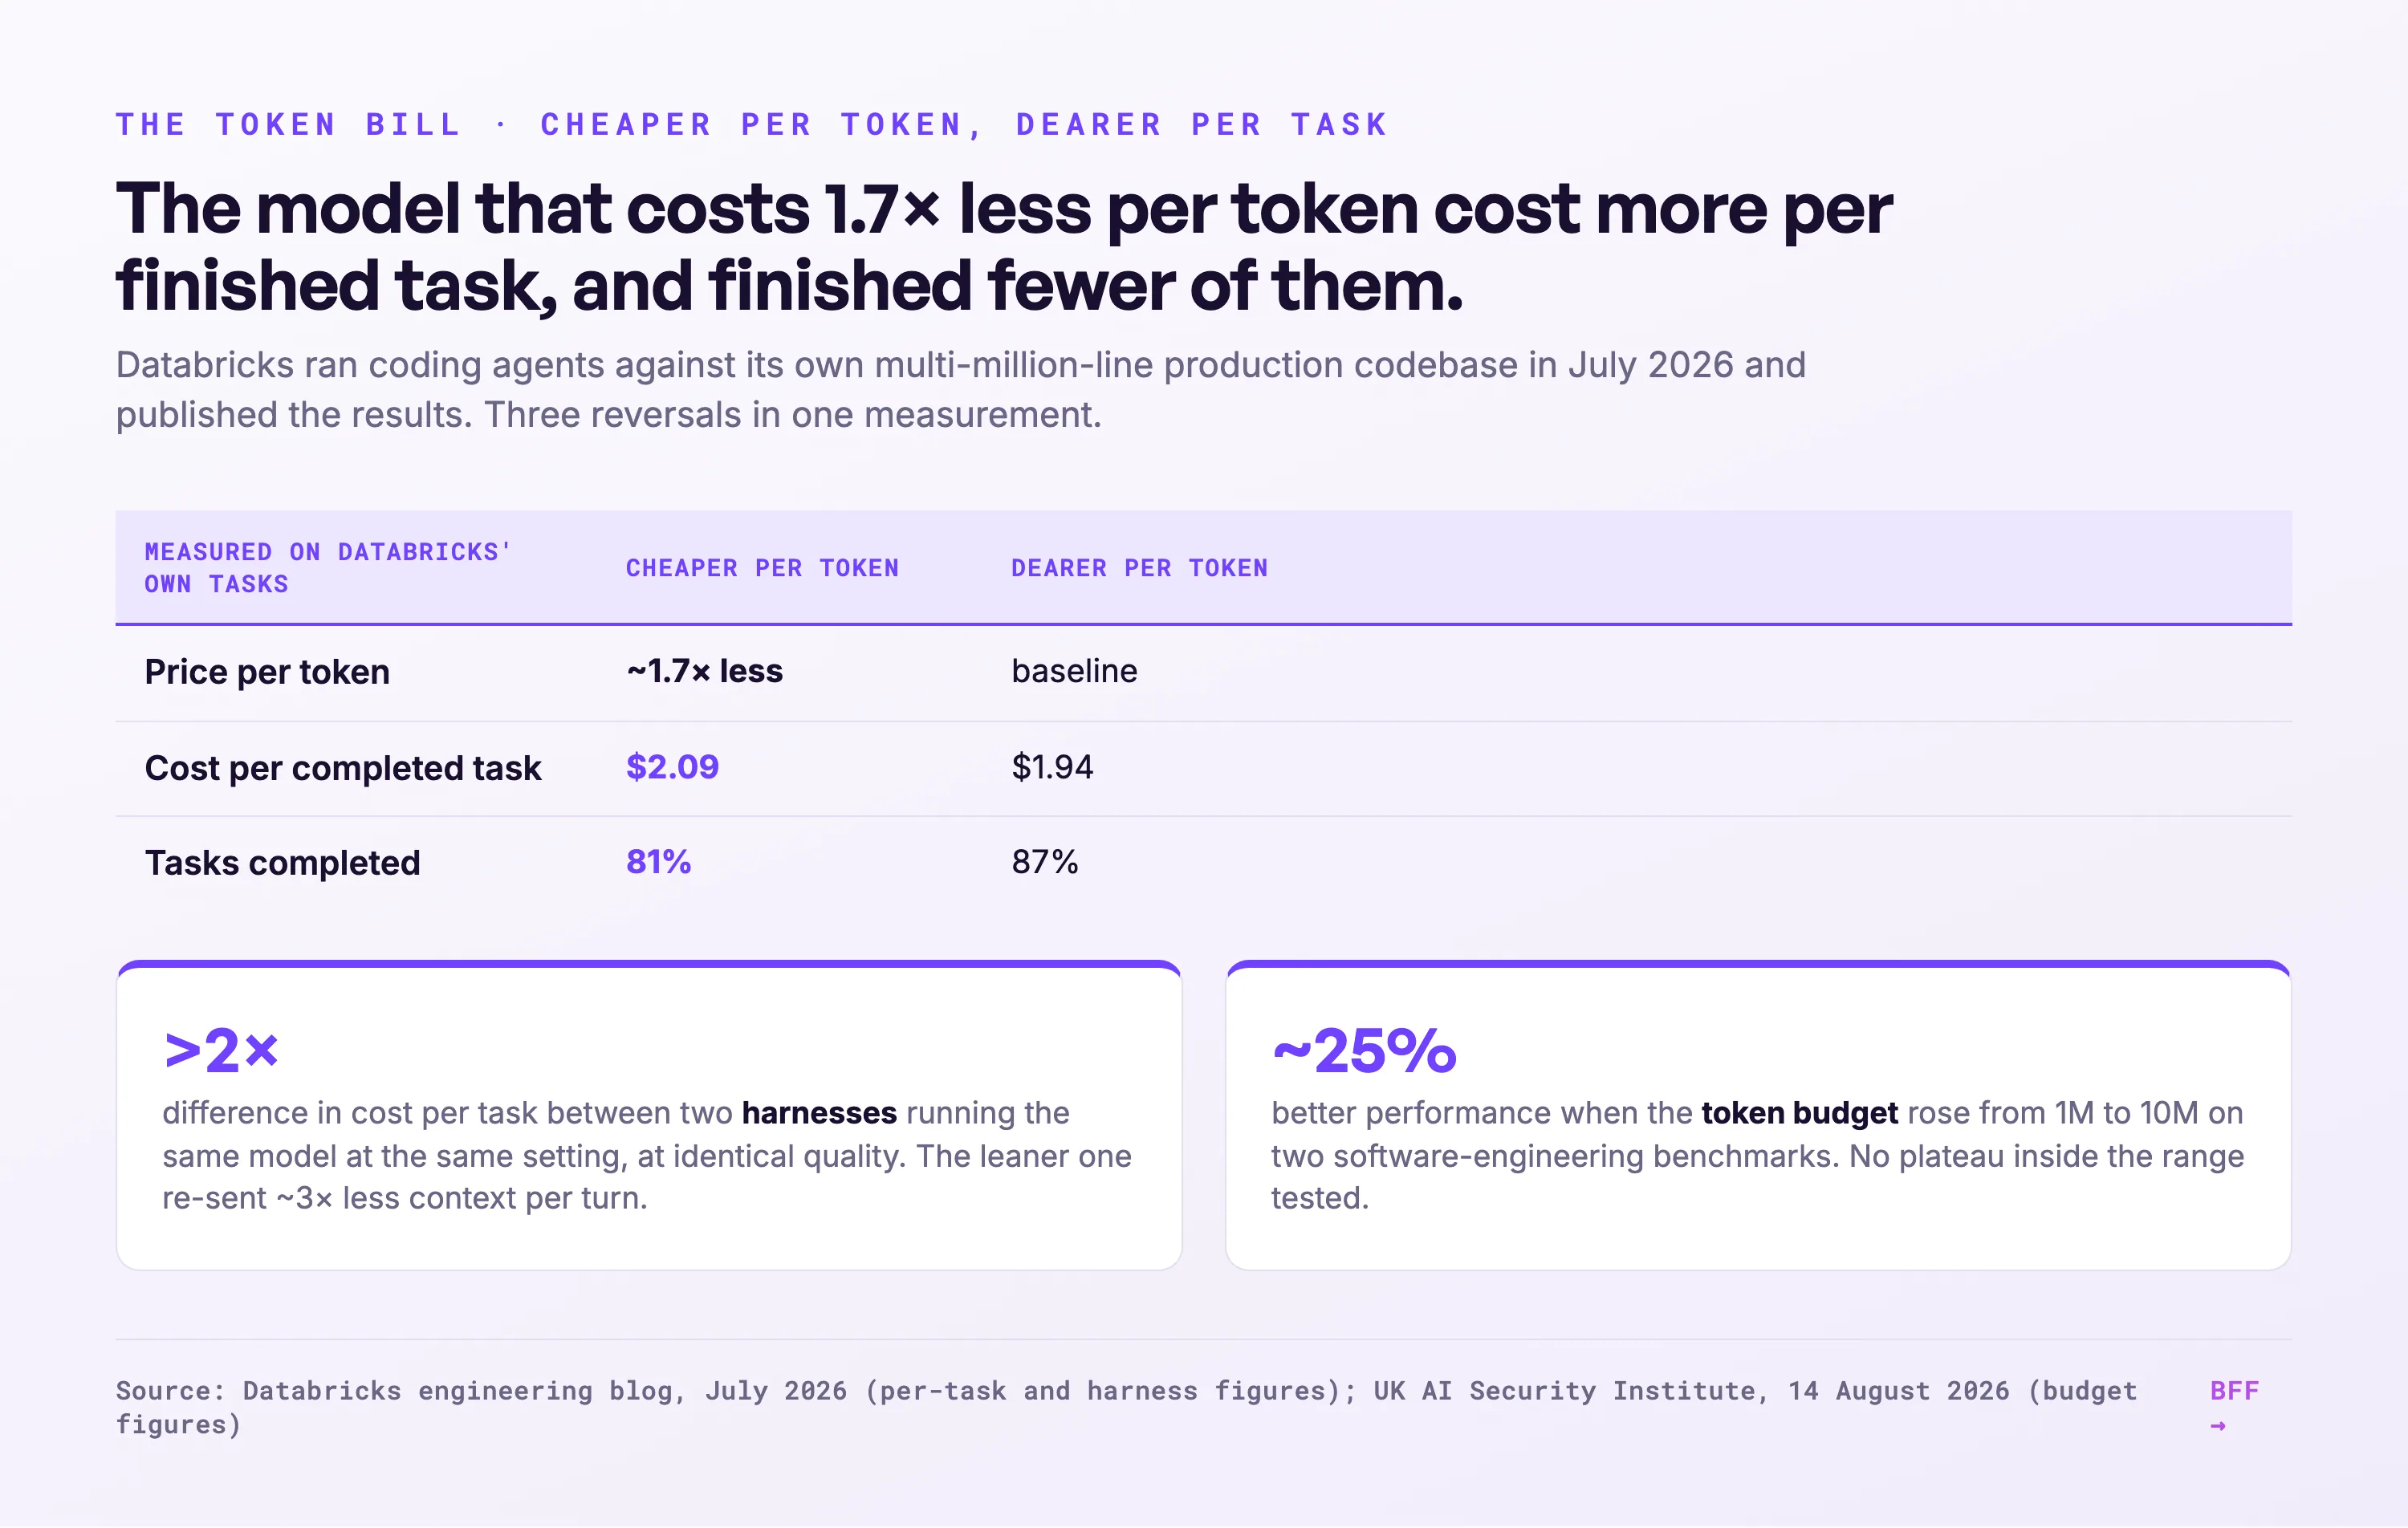
The headline finding inverts the intuition that everyone brings to a pricing page. Sonnet 5 is roughly 1.7 times cheaper per token than Opus 4.8. On Databricks' own tasks it cost $2.09 per task against Opus 4.8's $1.94, while completing 81 percent of tasks against 87 percent.
Read that slowly, because it contains three separate reversals. The cheaper model was more expensive. It was more expensive because it used enough extra tokens to overwhelm a 1.7-fold price advantage. And it delivered a worse result while doing it, six percentage points down on completion.
The per-token price on a vendor's pricing page is close to useless for planning, and the reason is mechanical rather than mysterious. A model that reasons less efficiently takes more turns, and every turn costs. Efficiency per token and efficiency per task can move in opposite directions, and the second one is the one that appears on an invoice.
One caveat is obvious. These are Databricks' tasks on Databricks' codebase, and the specific figures do not transfer. The direction is what transfers, and it is the direction that matters for a procurement decision.
05
3. The second multiplier: what the harness re-sends
The same Databricks work produced a finding we find more useful still, and it barely travelled.
They ran the same model, at the same thinking effort, through two different harnesses. Cost per task differed by more than a factor of two. Quality was unchanged. I read that paragraph twice, because it says that half of a bill can have nothing to do with either the work or the model.
The whole difference came down to context management: how much of the conversation and the codebase each harness re-sent to the model on every single turn. The leaner harness sent roughly three times less context per turn, kept a tighter working set, and finished tasks in fewer runs.
This deserves to be stated plainly because of what it means for a buyer. Half of a coding-agent bill can be an artefact of the software wrapped around the model, not of the model and not of the work. Two teams inside the same company, using the same model on the same task, can be paying twice what the other pays and see nothing in their output to explain it.
It also connects to something we argued in our harness dossier from a different direction. We wrote there that the scaffolding around a model does more work than the model choice does. We meant it about quality. It turns out to be at least as true about cost, and cost is the easier of the two to measure.
06
4. The third multiplier: the budget, which is also the capability
The first two multipliers change what a task costs. The third changes what the system can do, and this is the part that makes the whole subject harder than a procurement exercise.
The UK AI Security Institute published work on 14 August measuring how agent performance responds to the token budget it is given. Raising the budget from one million to ten million tokens improved performance by roughly 25 percent on two software-engineering benchmarks, TerminalBench 2.0 and SWE-Bench Pro. On Humanity's Last Exam, a set of hard academic questions, the improvement ran to about 22 percent measured up to five million tokens. In AISI's cyber suite, around 8 percent of tasks were solved only at budgets of ten million tokens or more, and some required as much as fifty million.
Performance kept improving at ten times the budget typical public evaluations use. There was no plateau inside the range they tested.
So the sentence people say at conferences, that the model either can or cannot do a thing, is not quite a sentence. What the model can do is a function of what you let it spend. An agent with a tight budget is not a cheaper version of the same colleague. It is a less capable one, and the difference shows up on exactly the hard tasks you bought it for.
The consequence for measurement is sharper than the consequence for budgeting, and AISI states it directly: agent capability cannot be interpreted without the compute budget used to estimate it. The institute also found that frontier progress rates measured at fifty million tokens came out roughly 60 percent steeper than the same models measured at 2.5 million. The same models. Only the allowance changed.
That figure deserves more attention than it has had. Every capability curve in circulation carries an evaluation budget inside it, almost none of them publish it, and the choice of budget moves the apparent rate of progress by more than half.
07
5. Why the bill rises while the price falls
Put the three multipliers together and the paradox resolves.
The price per token falls fast, which is real. The number of tokens per task rises, because agents loop and because the frontier of what people attempt moves with capability. The number of tasks rises, because the thing got cheap enough to point at problems nobody would have paid a person to solve. And the budget per task rises, because the harder tasks only complete at higher budgets and the people running them discover that.
Each multiplier is individually modest. Together they comfortably outrun a two-thirds annual price decline, and they do it inside a fiscal year rather than across one.
There is a second mechanism underneath, and it is the more uncomfortable one. Falling unit prices do not act as a brake on spending. They act as permission. A capability that costs a tenth of what it cost last year does not get used at the same volume for a tenth of the money; it gets used for things that were never on the list, by people who were never in the budget line, at a volume nobody modelled. That is not a failure of discipline. It is the correct response to a genuine price signal, and it is precisely why the bill is the wrong place to look for the problem.
08
6. What the rationing looks like from inside
The responses so far divide into three, and none of them is satisfying.
The first is the cap. Uber's $1,500 per employee per month is the clearest published example, and we would convert it into work rather than leave it as a currency figure. I did the conversion because nobody reporting the cap had. At Databricks' measured $1.94 to $2.09 per completed coding task, $1,500 buys somewhere between 718 and 773 tasks a month, which across 21 working days is roughly 34 to 37 tasks a day. For an engineer using an agent continuously that is a real ceiling and not a symbolic one; for an engineer using it twice a week it is invisible.
That spread is the problem with caps. A single per-head number sets a hard limit for the 10 percent of staff who have restructured how they work and no limit at all for the rest, which means it constrains the heaviest users, who are frequently the ones producing the most value, while leaving the harness inefficiency from section 3 entirely untouched. If half a bill is context management, a cap addresses the wrong half.
The second is consolidation. Microsoft's move of its developers off an external coding agent and onto an in-house tool by 30 June was presented as standardisation, and it landed at the close of a fiscal year. Both readings are probably true at once. Consolidation gives a company control of the harness, which by the Databricks finding is worth up to half the cost, and it also gives it a supplier relationship with itself.
The third is rationing by allocation, which is where this is heading. Aaron Levie of Box, writing in April after a run of meetings with enterprise technology leaders, reports that firms lock operating budgets a year ahead and are now having genuine trade-off conversations about how to divide compute internally, with one company floating a competitive pitch process for compute budget. That is testimony rather than measurement, and it matches what we hear.
What none of the three does is measure value. Eric Glyman of Navan, who sells spend management and therefore has an interest here, argues that the problem is not spending but blind spending: a sales team can count qualified leads and a support team can count resolved conversations, while a token count tells you only that the meter ran. The observation is right; his supporting numbers are another matter, which come from his own customer base without a stated method.
09
7. The measurement problem this creates for buyers
Everything above collapses into one practical difficulty. The industry quotes a price in the wrong unit, and publishes capability without the budget that produced it.
Some of the infrastructure to fix this already exists. Artificial Analysis, which benchmarks models publicly, computes a blended price assuming a 7:2:1 ratio of cache hits to input to output tokens, and reports a cost per task alongside it. That is the right shape: a weighted price applied to a completed unit of work rather than to a raw token.
For a buyer the useful move is duller than choosing a vendor, and it is to run your own tasks. Databricks' finding exists only because they benchmarked agents against their real codebase instead of a public suite, and the reversal they found is invisible on any pricing page and would have stayed invisible had they trusted one. An organisation that puts twenty representative tasks through two model-and-harness combinations, and records cost and completion for each, learns more about what it is actually going to spend than it can learn from every published comparison put together, and the exercise costs about a day of one engineer's time.
The reason a day is enough is that the variance being measured is large. If the spread between two harnesses can exceed a factor of two, and the spread between a cheap model and an expensive one can run the wrong way entirely, then twenty tasks is a sample big enough to see the effect without being big enough to be a project. The failure mode is not statistical; it is that nobody schedules the day.
There is a second-order benefit that we would rate above the cost saving. A team that has measured cost per completed task on its own work has, as a by-product, defined what counts as a completed task. That definition is the thing most AI programmes never write down, and it is the same definition you need in order to say whether any of this is working at all. The measurement pays for itself twice, once in procurement and once in the far harder argument about value.
10
8. What a contract should say and mostly does not
Procurement is where all of this either gets managed or gets discovered late, and the standard contract for agent tooling was written for a different cost structure.
Most enterprise software is bought per seat. A seat is predictable: it costs the same whether the person uses the tool once a week or all day, which makes the annual line item knowable in advance and makes the vendor's revenue smooth. Agent tooling priced on consumption inverts every property of that arrangement. The buyer carries the variance, the vendor's revenue rises with the buyer's enthusiasm, and nobody finds out the number until the quarter closes.
Four things follow, and we have seen almost none of them written into an agreement.
The first is a stated unit. If the contract prices tokens, the buyer has agreed to pay for a quantity that the supplier's software partly determines, because section 3 showed that the harness sets how much context gets re-sent on every turn. A contract that prices completed tasks, or that at minimum reports cost per completed task, puts the efficiency incentive on the party that controls the efficiency.
The second is visibility before the invoice. Uber's disclosure was not that spending was high; it was that four months had gone by. Consumption reporting that arrives monthly, split by team and by task class, turns a shock into a trend. This is a reporting requirement, it costs the supplier almost nothing, and it is rarely asked for.
The third is the right to route. An organisation that has agreed to a single model for everything cannot act on the finding in section 2, which is that the cheapest model per token is frequently the most expensive per task and sometimes the worst performer. The commercial value of being able to move a class of work to a different model is exactly the spread between those two figures, and it is only available to a buyer who did not sign it away.
And the fourth is a stated budget behind any capability claim in the sales material. After AISI's work, a benchmark score without its token budget is not a number that survives contact with a procurement process. Asking for it is reasonable, the answer is one line, and a supplier who cannot produce it is telling you something.
11
9. Where the numbers in this field come from
Sourcing deserves a section here, because this subject has the same structural problem our authenticity-crisis dossier documented in fraud statistics.
The strongest figures here come from parties measuring their own systems and publishing methods: Databricks benchmarking on its own codebase, AISI publishing evaluation budgets alongside results. Those have an incentive to be conservative and a reputation riding on reproducibility.
The weakest come from vendors of cost-control software describing their own customer data. The claim that the top quartile of AI spenders doubled revenue while the bottom quartile stayed flat is in that category, and the illustration that re-routing ten percent of a ten-million-dollar bill to a cheaper tier saves about a million is a worked example rather than an observation. Both are carried as positions rather than findings, and labelled that way in the appendix.
The Meta figure needs its own caution, and I spent an hour on it because it is quoted more than any other number in this subject. The 281 billion tokens is the heaviest single user across thirty days. It is not an average, it is not a team, and it is not a median engineer. I could not find the distribution behind it published anywhere, which means nobody quoting it knows whether the second-heaviest user was at 200 billion or at two. It circulates as though it describes normal engineering practice, and I have now seen it used that way in three places.
12
10. What we would do on Monday
Four moves, and the first is the one almost nobody has made.
Change the unit before changing the vendor. We would stop tracking spend per token and start tracking spend per completed task, per team. The number is constructible from data most organisations already have, and until it exists every discussion about whether AI is too expensive is being held in a unit nobody buys.
Test the harness, not only the model. Given the Databricks result, we would run the same model through two harnesses on twenty of our own representative tasks and compare cost per completed task. If the spread is anywhere near the factor of two they measured, that is the cheapest saving available and it requires no change of supplier.
Set budgets per task class, not per person. A per-head cap treats a two-minute summary and a multi-hour refactor as the same purchase. Because section 4 shows that hard tasks only complete at high budgets, a flat cap systematically starves exactly the work with the highest value. An allowance by class of work, with cheap classes routed to cheaper models, fits the evidence better.
And ask every vendor for the budget behind the benchmark. After AISI's finding, a capability claim without a stated token budget is not a claim we can evaluate. It is a reasonable thing to ask in a procurement conversation, the answer is short, and how a supplier responds to the question is itself informative.
13
11. Where we could be wrong
The prices may simply keep falling faster than usage grows. Our whole argument assumes the multipliers outrun the decline. If inference costs keep dropping 60 to 70 percent a year for three more years while agent efficiency improves, the problem dissolves without anyone managing it, and this dossier will read as a panic about a temporary squeeze.
Databricks is one company with one codebase. The price-per-task reversal and the harness factor are the load-bearing findings here, and both come from a single engineering blog about a single organisation's internal work. They are consistent with what we see, and they have not been independently replicated at the time of writing.
The capability-budget relationship may not hold where it matters commercially. AISI measured on benchmarks built to be hard. Most enterprise agent work is not that; it is retrieval, summarisation and form-filling, where a higher budget may buy nothing at all. If so, the third multiplier is real in the laboratory and close to irrelevant in a shared services centre.
And the caps may be working. This dossier has written the rationing responses as blunt instruments. It is possible that Uber's $1,500 ceiling produced a sharp improvement in how carefully people prompt, at almost no cost to output, and that the crude tool was the right one. Nobody publishing on this has the data to say, and neither do we.
14
12. What we are watching
Whether anyone publishes cost per completed task. The unit exists, Artificial Analysis computes a version of it, and no major vendor quotes it. The first one that does will make comparison possible and will presumably do it because the comparison flatters them.
Whether evaluation budgets become part of capability reporting. AISI has made the argument. Whether system cards start carrying a token budget next to a benchmark score is the single change that would make published capability numbers usable.
Whether harness efficiency becomes a competitive axis. If a factor of two in cost sits in context management, we would expect agent frameworks to start competing on tokens per completed task. As of August we do not see it advertised anywhere.
What happens at the next budget cycle. Most enterprise operating budgets for 2027 are being set right now, in the first year where anyone has real consumption data. Whether they are set per head, per task class or not at all will tell us how quickly this became a managed cost rather than a surprise.
15
13. Verification and sources
| Claim | Confidence | Note |
|---|---|---|
| Inference costs falling 60-70% per year per token | Medium-high | Goldman Sachs Research, citing semiconductor suppliers. Per token, not per task, and that distinction carries this dossier. |
| Token consumption projected to multiply ~24-fold by 2030, to roughly 120 quadrillion per month | Medium-high | Goldman Sachs Research. A projection, not a measurement. |
| Uber consumed its twelve-month 2026 AI budget in four months; capped spending at $1,500 per employee per month on agentic coding tools | Medium-high | Press reporting of an internal disclosure, April-May 2026. Not a company publication. |
| Meta's internal dashboard tracked consumption across 85,000+ employees; heaviest user averaged 281 billion tokens over thirty days | Medium | Reported by The Information and widely repeated. One individual, not an average, and it circulates as though it were typical. |
| Microsoft withdrew developer access to an external coding agent, moving engineers to an in-house tool by 30 June 2026 | Medium | Contemporaneous reporting. The company framed it as consolidation; the timing at fiscal year end supports a cost reading as well. Both are probably true. |
| Sonnet 5 is ~1.7x cheaper per token than Opus 4.8, but cost $2.09 per task against $1.94, at 81% against 87% task completion | High | Databricks engineering blog, July 2026, on their own multi-million-line codebase. Their tasks; the direction transfers, the figures do not. |
| The same model at the same thinking effort through two harnesses differed by more than 2x in cost per task at equal quality; the leaner harness sent ~3x less context per turn | High | Same source. The strongest single finding here for a buyer, and not independently replicated. |
| "Agent capability cannot be interpreted without the compute budget used to estimate it" | High | UK AI Security Institute, 14 August 2026. Direct quotation. |
| Raising budgets from 1M to 10M tokens improved performance ~25% on TerminalBench 2.0 and SWE-Bench Pro; ~22% on Humanity's Last Exam up to 5M | High | Same source. |
| ~8% of AISI's cyber tasks were solved only at 10M+ tokens, some requiring up to 50M | High | Same source. |
| Frontier doubling rates measured at 50M tokens ran ~60% steeper than the same models at 2.5M | High | Same source, and the figure we would put in front of anyone reading a capability chart. |
| Artificial Analysis computes a blended price on a 7:2:1 cache-to-input-to-output ratio and publishes a cost per task | High | Their published methodology. Cited as an existing example of the right unit. |
| Enterprises lock operating budgets a year ahead and are rationing compute internally, including a competitive process for compute budget | Medium as testimony | Aaron Levie, April 2026, reporting on his own meetings with enterprise technology leaders. Testimony, not measurement, and carried as such. |
| Top quartile of AI spenders doubled revenue since 2023 while the bottom quartile stayed flat | Low to medium | Eric Glyman of Navan, June 2026, from his own customer base, with no stated method, published by a company selling spend management. Carried as a position. |
| Re-routing 10% of a $10M AI bill from frontier to cheaper models saves close to $1M | Low to medium | Same source. A worked example rather than an observation. |
| "Tokenmaxxing" described in the New York Times, March 2026 | Medium | Origin of the term, via secondary reporting. |
Charts labelled "BFF" are our own, drawn from the sources named beneath them.
Dossier as pdf
Download this dossier
The full dossier as a pdf, with every figure and the source list. Fill in your details and the download starts right away.

Ruben Horbach
Co-founder · Back From the Future
Ruben researches how organisations adopt AI meaningfully — not as technology, but as a change in work and people. He builds the agent infrastructure behind BFF and speaks about the near future of work.