
01
Why this, why now
We published the first version of this dossier on 17 July 2026. The second-quarter results landed between 22 and 31 July, which is to say five days later, and they moved enough of the load-bearing numbers that a patch would have been dishonest. This is a rewrite.
What changed is not the direction. It is the timing and the plumbing. The crossover from earned money to borrowed money was supposed to be a 2027 story for most of the group; for Alphabet and Meta it happened in the June quarter. The financing story turned out to have a third channel nobody was tracking, because Alphabet raised nearly $85 billion of equity in June and the two largest AI labs both filed confidentially to go public. And a mechanism surfaced in August that changes how you should read every earnings statement in this sector: a large share of the capital that has been spent has not been placed in service, so it is not yet depreciating, which means reported profits currently flatter the economics of the build.
The scale remains difficult to hold in the head. According to Exponential View, which published an analysis of company guidance on 10 August 2026, seven of the largest infrastructure builders expect around $863 billion of capital expenditure this year, up about 88 percent on last. That is larger than the annual economic output of most countries. It is being decided by perhaps two dozen people, over a horizon of three or four years, on assumptions about demand that nobody can yet check. And for the first time a meaningful slice of it is borrowed rather than earned.
That fact sits under everything below. It also sits under every board that now depends on cloud AI, which is to say almost all of them, and that is the reason a dossier about somebody else's balance sheet belongs on the desk of people who will never build a data centre.
Timeline
- 2024 — Hyperscalers fund AI capex comfortably from operating cash flow.
- 2025 — The first "is AI a bubble" frameworks appear, along with the circular-financing critique.
- Q1 2026 — Hyperscaler capex has quadrupled since GPT-4.
- 31 March 2026 — OpenAI closes a $122 billion round at an $852 billion valuation. Amazon puts in $50 billion, Nvidia and SoftBank $30 billion each.
- 2-3 June 2026 — Alphabet prices an $84.75 billion equity raise, upsized from $80 billion. Berkshire Hathaway takes $10 billion.
- 16 June 2026 — Epoch AI projects aggregate capex to overtake operating cash flow around Q3 2026.
- 22-31 July 2026 — Q2 results. Alphabet's free cash flow goes negative. Meta's falls 91 percent. Amazon's turns negative on a trailing-twelve-month basis. Microsoft extends the useful life of its data centre buildings from 15 to 25 years.
- 10-13 August 2026 — The deployment gap is quantified. Epoch publishes a case study concluding financing is probably not the binding constraint.
02
Contents
1. The crossover arrived early
2. Three ways to pay for it
3. The bear case, honestly
4. The bull case, honestly
5. The ledger
6. Circular financing, examined
7. Depreciation: the number that decides it
8. The waiting room
9. The leveraged edge
10. The historical rhyme
11. What actually breaks it
12. What a business does when its infrastructure runs on debt
13. What we are watching
14. Verification and sources
03
1. The crossover arrived early
One relationship explains why the mood shifted this year. Across the five largest cloud builders, cash capital expenditure has been compounding at roughly 70 percent a year while the operating cash flow that pays for it compounds at roughly 23. Two lines growing at those rates cross, and the only interesting question is when.
According to Epoch AI, which works directly from SEC filings and published its answer on 16 June 2026, the aggregate crossing lands around the third quarter of 2026. Underneath that headline sits a staggered order: Oracle already through, Amazon crossing around the second quarter, Alphabet not until early 2027, Meta later that year, and Microsoft, sitting on the deepest reserves of the group, holding out until 2028.
That projection is now six weeks older than the evidence. When I went back to the Epoch page in August to check whether it had been refreshed for the second quarter, it still carried its June date, which matters because the June quarter did not behave the way the trend line said it would.
Here is what the filings show.
Alphabet reported on 22 July, and the top of the statement was a good quarter by any measure: revenue of $119.8 billion, up 24 percent, operating income of $40.8 billion, cloud revenue up 82 percent. Further down, quarterly capital expenditure of $44.9 billion turned free cash flow to negative $5.9 billion. Meta reported a week later, on 29 July, and the shape repeated. Revenue grew 28 percent. Capital expenditure of $31.08 billion, set against operating cash flow of $31.86 billion, left free cash flow of $784 million, which is a rounding error at Meta's scale and a fall of roughly 91 percent on the year. Amazon reported the same day. Its quarterly capital expenditure ran to $54.2 billion against $32.1 billion a year earlier, and free cash flow for the trailing twelve months came in at negative $7.6 billion, against positive $18.2 billion for the twelve months to June 2025. According to Amazon's own release, that swing of nearly $26 billion follows a $66.1 billion year-on-year increase in purchases of property and equipment.
Two of those three companies were not supposed to be here until 2027.
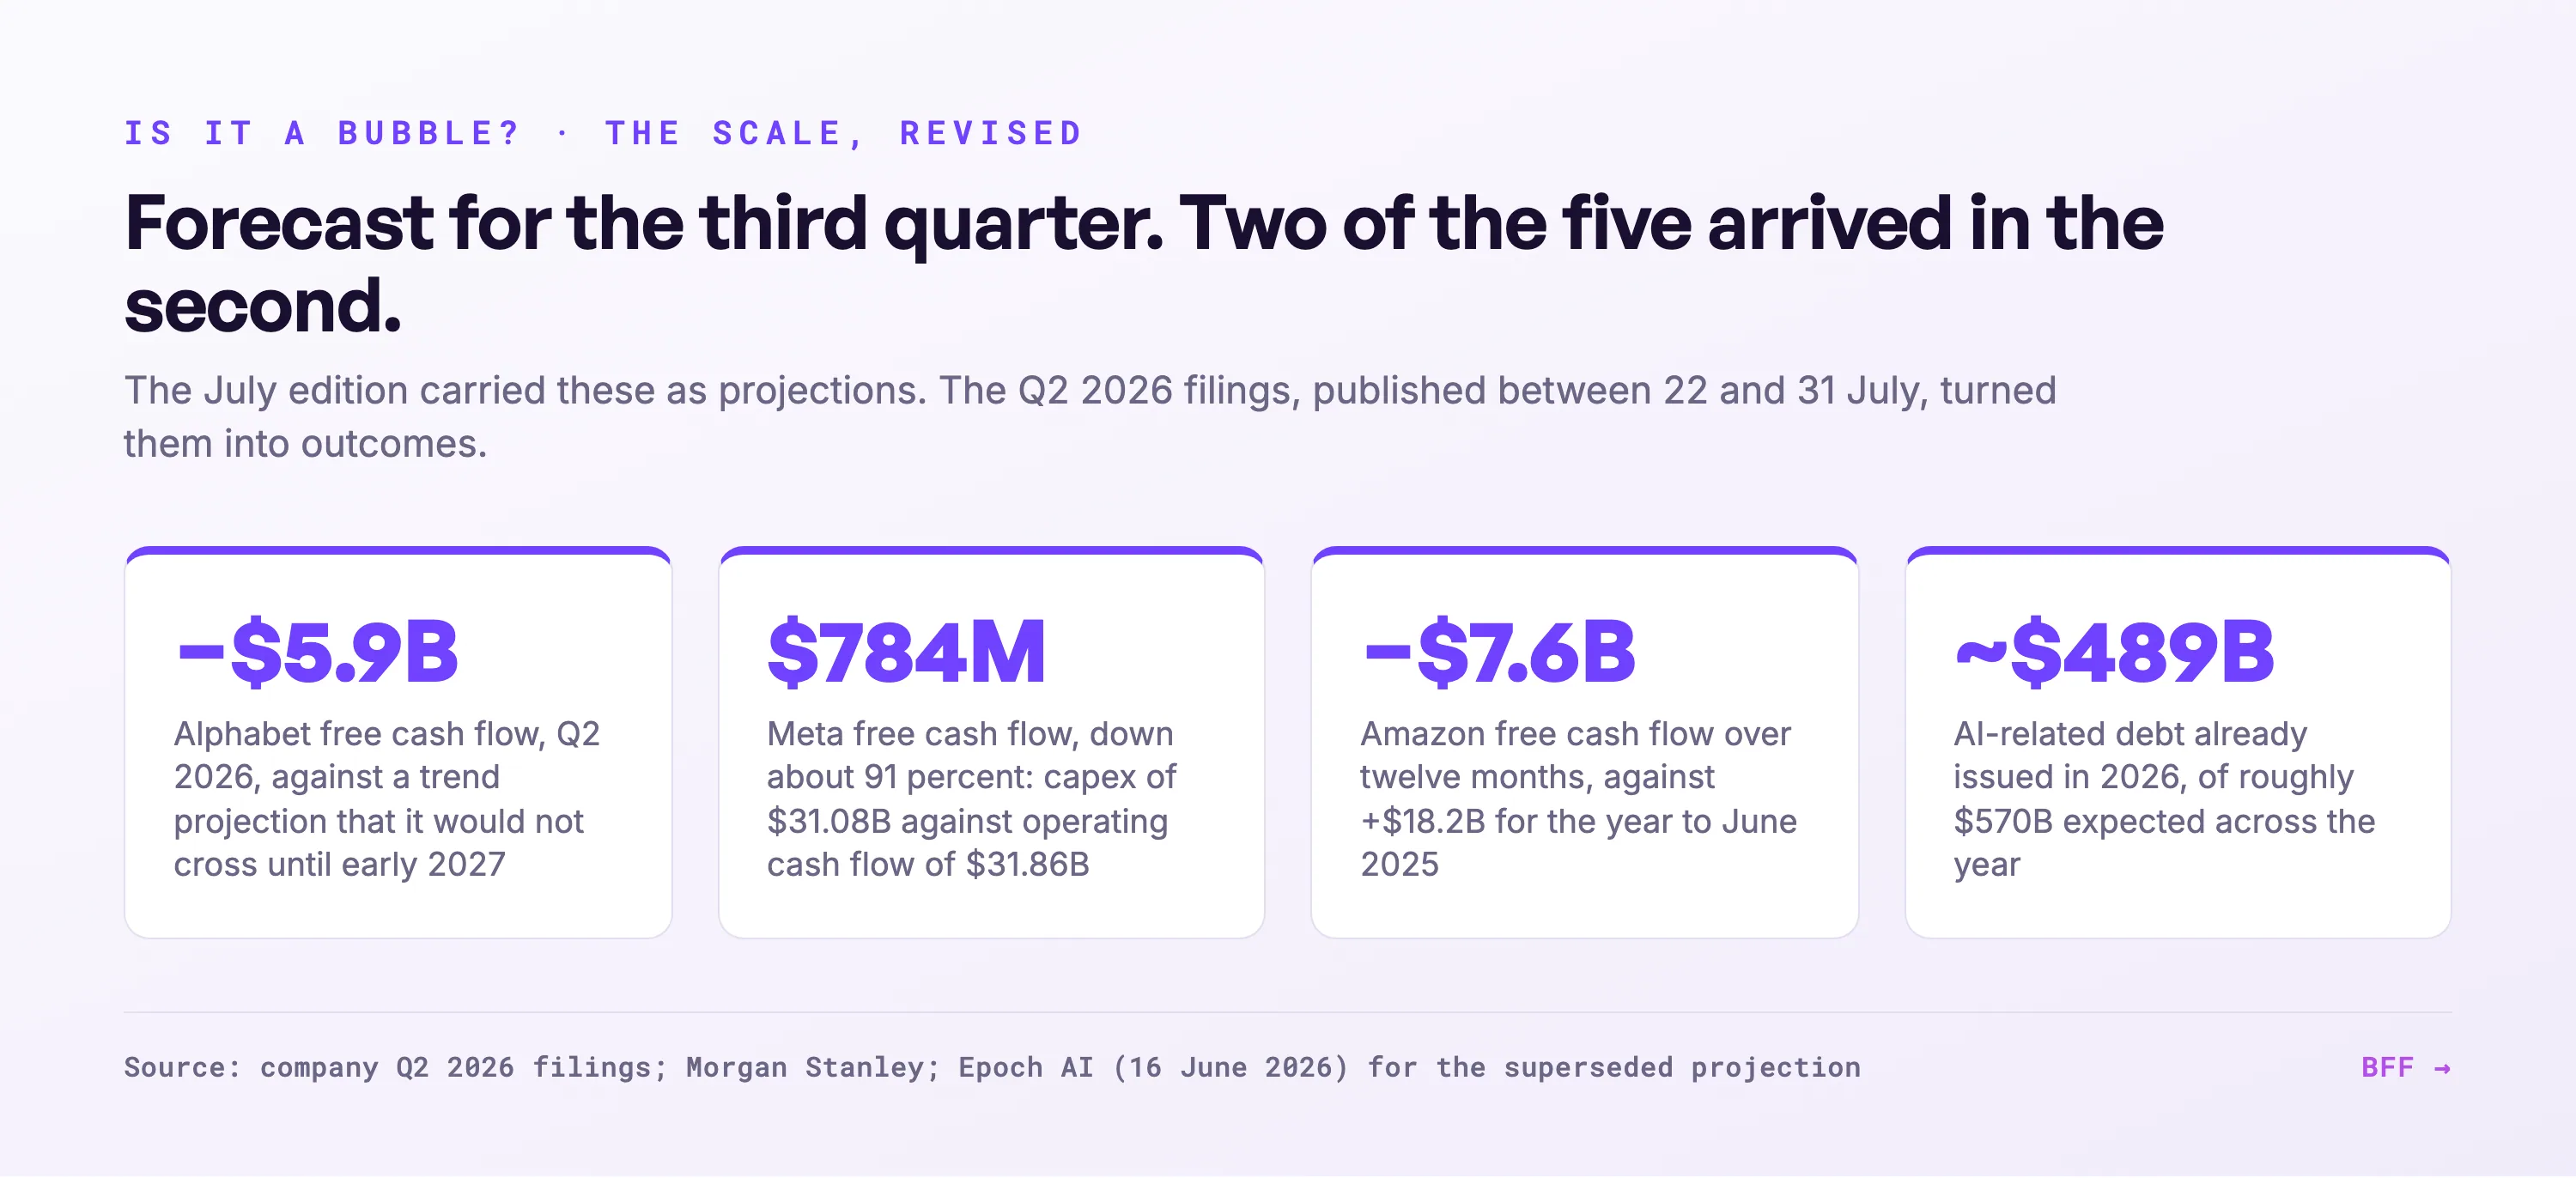
We would draw a distinction here, because this is where the argument gets sloppy in both directions. Epoch models a trend, and a trend crossing is a sustained condition; a single quarter of negative free cash flow is a point observation, and quarterly capex is lumpy in a business where a substation slips a month and $4 billion moves with it. Alphabet has not permanently stopped funding itself. What the quarter does establish is that the buffer between spending and cash generation has gone, at two of the three companies Epoch had comfortably on the far side of the line, two to four quarters ahead of schedule. We treat the exact crossing dates as directional. About the direction we have no doubt.
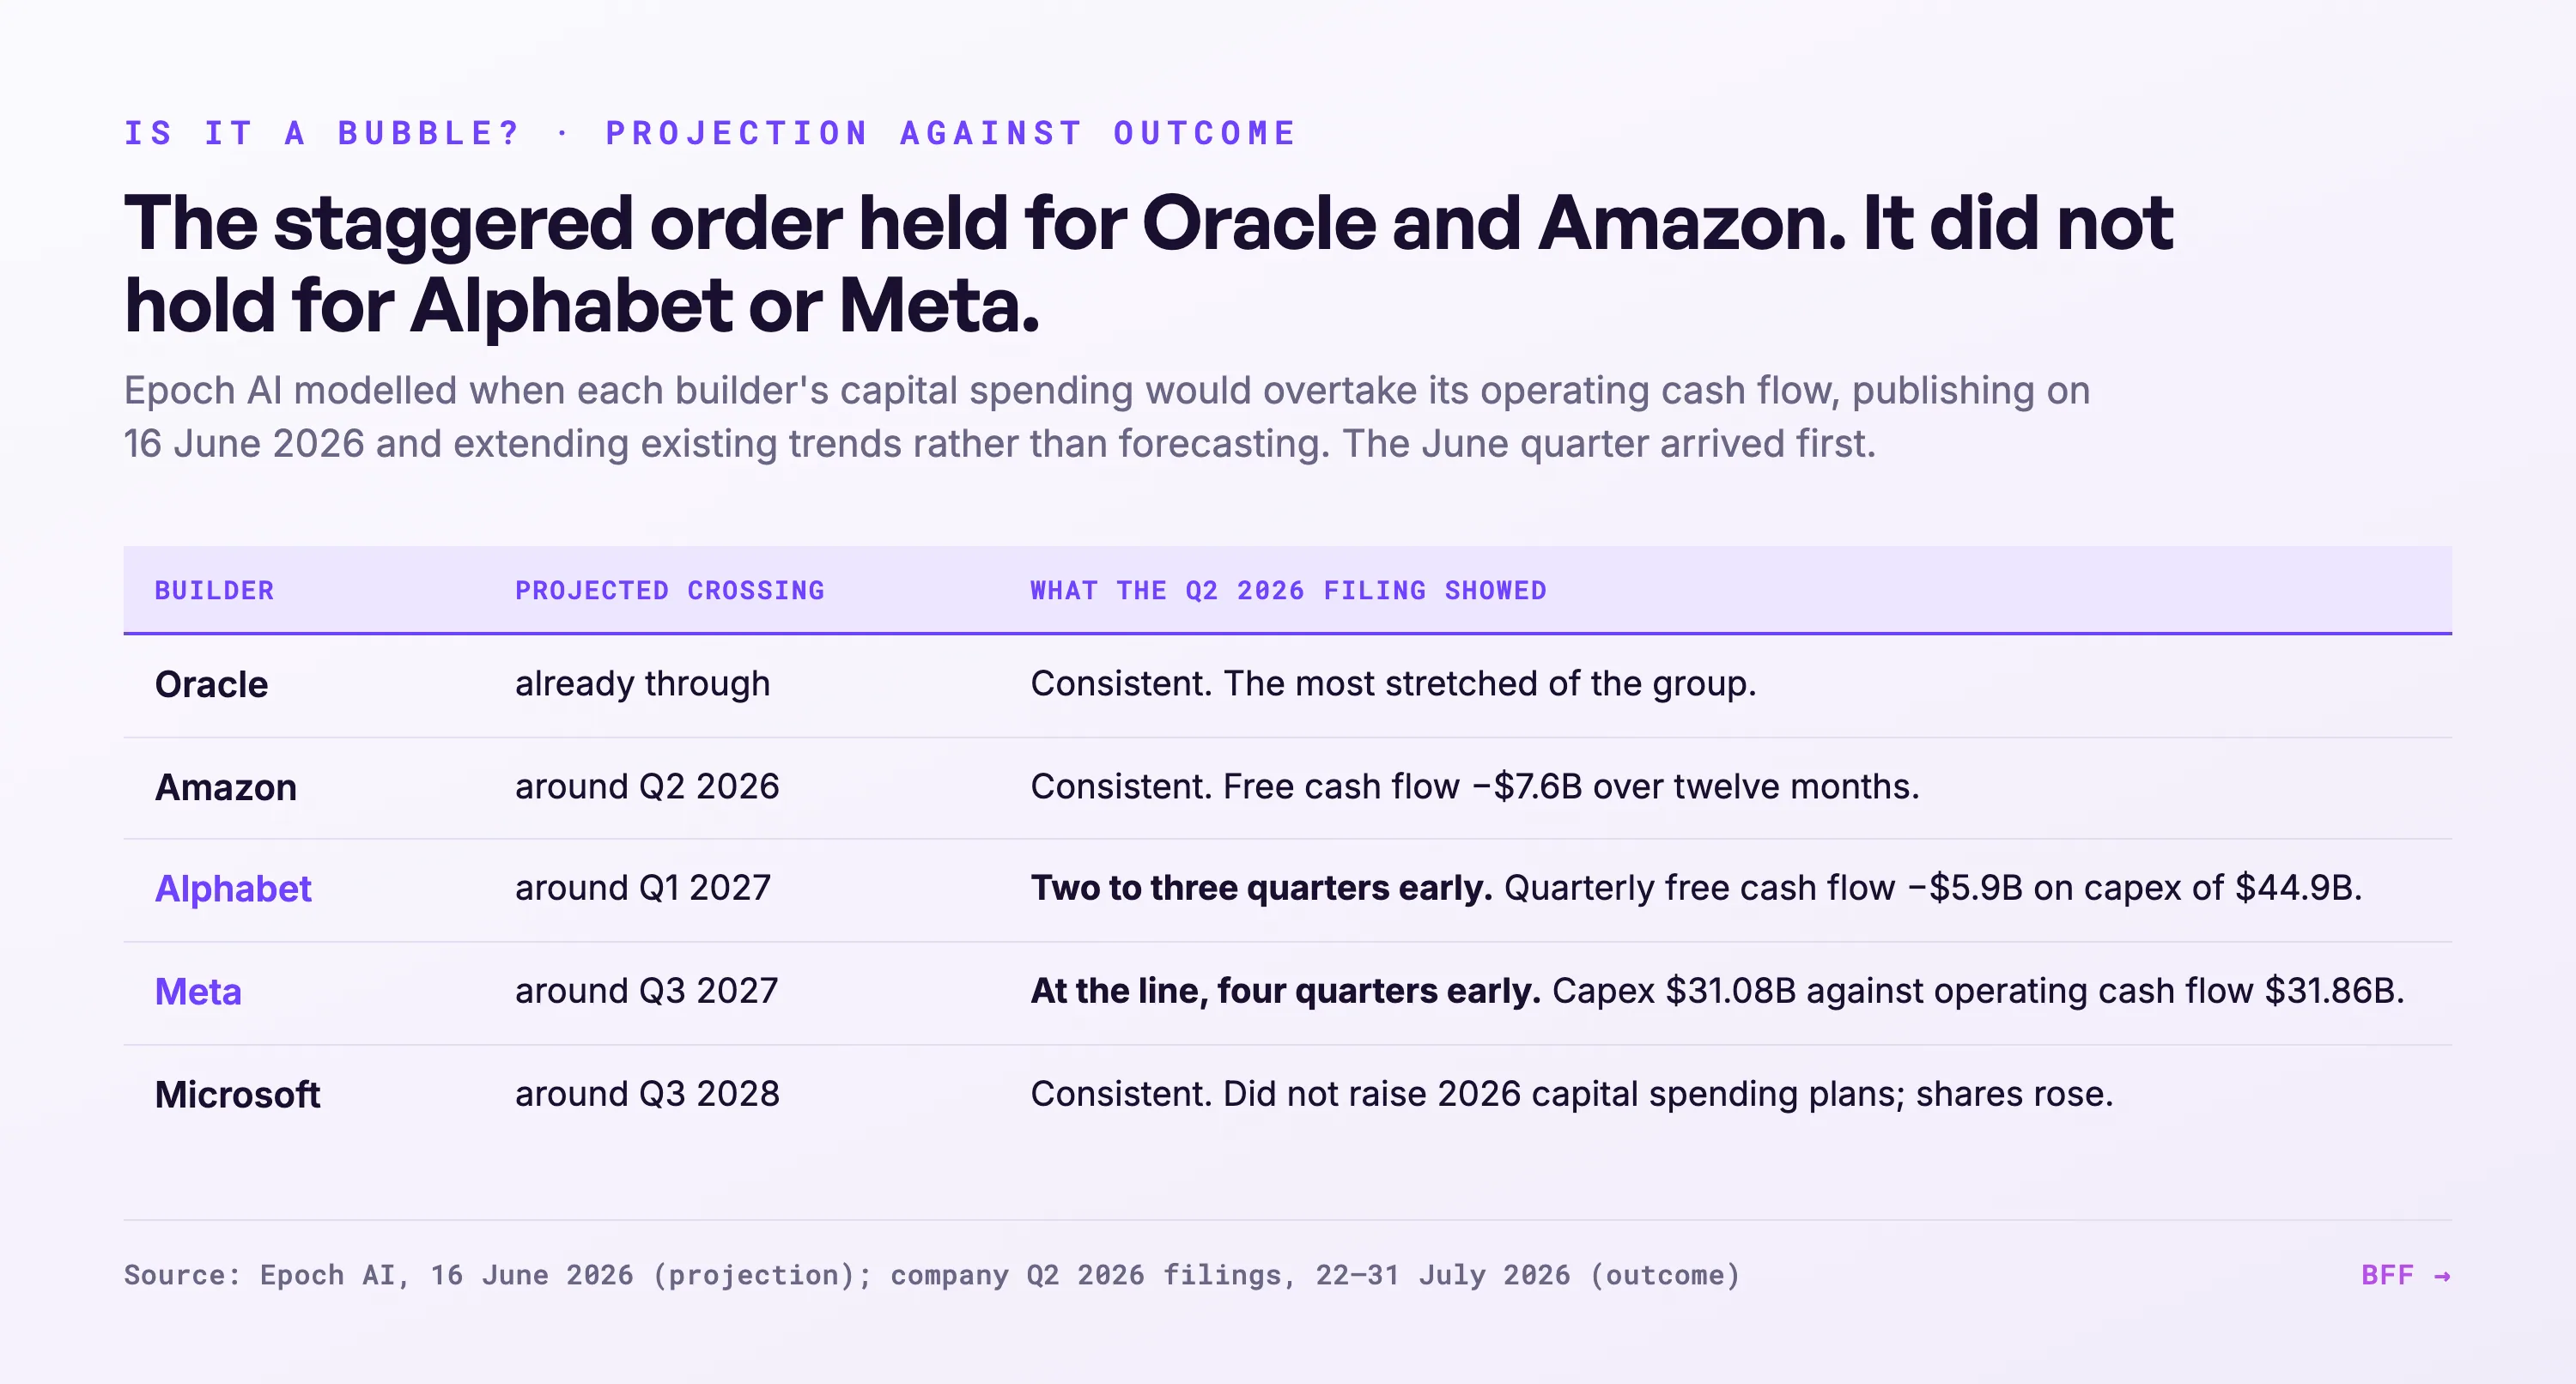
Microsoft is the exception we would name, and we find it instructive. It reported on 29 July with revenue of $90.01 billion, Azure up 43 percent and past $100 billion of annual revenue for the first time, and it did not raise its 2026 capital spending plans. Its shares rose about 3 percent. Alphabet and Meta both raised guidance and both sold off. Within the space of eight days the market stopped treating capital expenditure as a single signal and started asking who was spending against demand it could already show.
04
2. Three ways to pay for it
The first edition of this dossier described a shift from earned money to borrowed money. That was half right. There are three channels, and the third one is the largest single transaction in the set.
Earned. Still the biggest source, and the one the coverage keeps forgetting. Exponential View reports that cash flow continues to fund roughly two thirds of the buildout across the seven builders it tracks. When we see this described as a debt-financed bubble, we think the denominator is wrong.
Borrowed. The share is climbing fast. According to FactSet, incremental annual debt ran at 9 percent of capital expenditure in FY2024 and reached about 32 percent by the middle of this year, which is a tripling of the funding mix inside two years. Morgan Stanley estimates roughly $570 billion of AI-related debt issuance across 2026, of which around $489 billion had come to market by the time of writing. The individual deals are large enough to be their own news: Amazon went to the bond market twice inside four months, $37 billion in March and at least $25 billion more in July, and Meta is assembling a $12 billion special-purpose vehicle backed by BlackRock for a roughly one-gigawatt site in El Paso.
Issued. On 2 and 3 June 2026 Alphabet priced an equity capital raise of $84.75 billion, upsized from an announced $80 billion, combining common stock, mandatory convertible preferred, a $40 billion at-the-market programme and a $10 billion private placement taken by Berkshire Hathaway. Alphabet did not need the money in any covenant sense. It raised it anyway, and we read that as the finance function pricing the next three years.
Underneath that sits a fourth channel that is really the third one wearing a different hat. OpenAI closed a $122 billion round at an $852 billion post-money valuation on 31 March 2026, the largest private fundraise on record, and it filed a confidential S-1 on 8 June. Anthropic raised a $65 billion Series H at $965 billion post-money on 28 May, filed its own confidential S-1 on 1 June, and has positioned that round as its last private one. Fortune reports Anthropic's listing ambition at $2 trillion or higher, possibly as soon as October.
So the question "who is paying for all of this" now has a fourth answer the July edition did not consider: retail and index investors, at scale, fairly soon. We do not offer that as a warning. It is a change in who carries the risk, and it is the change that historically arrives late in a build rather than early.
05
3. The bear case, honestly
Take the pessimists at their strongest, because the strong version is the one worth answering. Their argument has two legs.
The first is the gap between spending and revenue. Microsoft has committed on the order of $300 billion in AI capital expenditure against something like $18 billion of AI revenue. OpenAI is losing money at a rate that requires a $122 billion round to sustain. Enterprises, the bears add, burn through annual AI budgets in a matter of months with little measurable return, which is the finding our own adoption-gap dossier examines in detail.
I want to be straight about where those figures come from, because the first edition was not. I traced the three most-quoted numbers in this paragraph and they resolve to a single post on X dated 22 May 2026, not to three independent analyses. The post is a fair summary of a real argument and its figures are in the right area. It is one analyst's set, and calling it "widely cited" describes its circulation rather than its provenance. The Microsoft comparison in particular depends heavily on what counts as "AI revenue", a line the company does not report, so read it as an order of magnitude and not a ratio.
One figure from that set has since broken outright. It claimed Anthropic spends three dollars for every dollar it earns. Anthropic's run-rate revenue went from under $9 billion in November 2025 to over $47 billion by May 2026, and Fortune reported on 14 August that the company was expected to post an operating profit in the second quarter. Whatever the ratio was in May, it is not that now.
The second leg is structural and it survives the update intact: much of the demand may be circular. That claim gets its own section below. Stated as fairly as we can put it, the bear case grants that AI is real and worries about something else. The economics of the buildout rhyme with the ones that broke telecoms in 2001, and the market has priced in returns that have not yet arrived.
06
4. The bull case, honestly
Now the optimists, also at their strongest.
Their first point is demand, and it has been the better prediction. Exponential View, which has run a five-indicator bubble test derived from three centuries of investment booms and busts and reached the same verdict each time, reported on 1 June 2026 that only one of those indicators sat in the red, the rest ranging from green to amber. It argues that the "boom, not bubble" line holds because revenue growth accelerated where the bear case required it to decelerate. Anthropic's five-fold run-rate increase in six months is the clearest case, and by its own account it surprised Anthropic.
Their second point is the nature of the asset. The dark fibre of 2001 sat unlit for years waiting for demand that had been promised rather than booked. GPUs are put to work quickly and utilisation runs high. Section 8 complicates this considerably, and it is the strongest available objection to the bull case, but the underlying claim that installed capacity earns is still broadly right.
Their third point is capacity to pay, and Epoch argues it forcefully in a case study of Anthropic's financing published on 13 August 2026. Anthropic assembled roughly $50 billion of infrastructure commitments while its revenue was still under $9 billion: $35 billion of debt against more than a gigawatt of Google TPU systems, and $15.2 billion against five data centres providing 1.43 gigawatts, with Apollo, Blackstone and a syndicate of banks putting up most of the capital in advance. Epoch's conclusion is blunt, and it cuts against this dossier's own framing. It finds that financing is unlikely to be the binding constraint on frontier compute growth in the near term. Institutional money turned up at a scale that was genuinely uncertain a year ago, for a borrower with barely two years of operating history.
Stated as fairly as we can put it, the bull case is that real technology with real and rapidly growing revenue is being funded by parties who can afford it, and that calling it a bubble confuses expensive with unsound.
07
5. The ledger
Put the two cases side by side and something useful appears. We do not read this as a debate where one side has the facts and the other has the feelings. Both rest on real numbers from real filings, and the disagreement is mostly about which denominator dominates.
Two examples of that, since it is the whole methodological point of this series. Epoch says capex is overtaking operating cash flow; Exponential View says cash flow still funds two thirds of the build. Both are measured correctly. Epoch is comparing the flow of new capital spending against the flow of new operating cash at five companies, which is the marginal question. Exponential View is measuring the funding mix of total spending across seven, which is the average question. A build can be two-thirds self-funded in aggregate and still fund its next increment entirely from markets, and that is where we are.
Our position is to refuse to pre-commit. A bubble and a boom look identical right up until demand either shows up or does not. What separates a serious observer from a spectator is knowing in advance which figures would settle it: the revenue curve of the biggest spenders, the share of installed capacity actually earning, the terms on the new debt, and whether the circular deals keep the cash moving.
08
6. Circular financing, examined
The circular-financing worry deserves a clear head, because it is both real and easy to overstate, and because 2026 made it considerably more concrete than the arm-waving version.
The mechanic is simple. A chipmaker invests in and supplies a lab. The lab commits hundreds of billions to cloud providers. Those providers buy chips to deliver the capacity. The same dollars can travel that loop, and when they do, demand looks organic and revenue looks robust while a portion of it is one circle of money spinning faster.
In 2026 the loop closed in public. Of OpenAI's $122 billion March round, Amazon put in $50 billion and Nvidia $30 billion — its cloud supplier and its chip supplier, now also two of its largest shareholders. Anthropic's $65 billion Series H in May included Samsung, SK Hynix and Micron as strategic chip-supply investors, memory makers taking equity in a company whose demand sets the price of memory. Amazon, three months later, raised its own 2026 capital expenditure guidance to about $220 billion and cited higher memory costs as a reason. I am not claiming those two facts are causally linked; I am pointing out that we now have an industry where it is genuinely difficult to tell an arm's-length price from a related-party one.
The best single number on this came from Epoch on 13 August, and it is the most useful thing I read all month, because instead of describing the circularity it prices it.
Epoch reports that Anthropic raised $4.5 billion of compute financing carrying no vendor backstop, at 8.5 percent. Comparable financing that Broadcom and Google backstopped, roughly $30 billion of it, priced at 5.75 percent. Do the subtraction and you have 275 basis points, which is what lenders charge to take direct exposure to an AI lab rather than exposure to a supplier's guarantee. It is the only place in this whole argument where the market has been asked to put a figure on the thing everybody is worried about, and it answered.
Read one way that is reassuring. Capital was available without any backstop at all, at a price that is high but ordinary for an unrated borrower, which is a real market and not a refusal. Read the other way, roughly seven of every eight dollars in that programme wanted the guarantee anyway.
The risk has a name we keep coming back to, the keystone problem. If one large node in the loop stumbles, the circularity that made everything look strong on the way up makes it look fragile on the way down. That is exactly what turned the telecom boom into the telecom bust, and it is the mechanism, not the analogy, that deserves the attention.
09
7. Depreciation: the number that decides it
Underneath the trillion-dollar headlines sits a single unglamorous assumption that decides whether any of this pays: how long the equipment lasts.
Epoch estimates the up-front capital for a one-gigawatt data centre at about $38 billion, or roughly $8.5 billion a year once spread across the assets' lives. Servers account for 60 percent of that annual cost. The accelerators alone are 39 percent of the capital expenditure, and by Epoch's reckoning Nvidia's gross profit comes to close to 29 percent of the total cost of everything: nearly a third of what it costs to build and run one of these sites is one supplier's margin.
The load-bearing input is the depreciation schedule, assumed at five years for the chips. Shorten it to three and the annual cost rises to about $12 billion. Stretch it to seven and it falls to around $7 billion. The same physical building, the same chips, the same electricity bill, and a swing of roughly 70 percent in what it costs to run per year. That is the entire argument in one variable. If each new generation of accelerator makes the last one uneconomic to operate, the owner is carrying an expensive asset that stopped earning before it was paid off. Energy dominates the news coverage. Obsolescence dominates the returns.
Which brings us to the thing the July edition told readers to watch for, twelve days before it happened.
On 29 July 2026 Microsoft extended the estimated useful life of its office and data centre buildings from 15 years to 25. Precision matters here, and the coverage was sloppy about it: this is a change to shells and land improvements, not to chips, and a 25-year life for a building is unremarkable by the standards of any other industry. We think it is a defensible change. It is also a change that reduces reported depreciation during the steepest capital expenditure ramp in the company's history, disclosed alongside a lease reclassification, in a quarter when the market was scrutinising exactly this. Both things are true at once, and we would hold them together.
We hold the broader pattern next to it, because it did not start this summer. Between 2020 and 2024 the large technology companies steadily extended server lives, from three or four years out to six, and contemporaneous analysis reports that the change removed billions from annual depreciation across the group. Then in 2025 the trend split. Amazon shortened the life of a subset of servers, at a cost of about $700 million to its reported operating income for that year, while Meta went the other way and extended.
We find that divergence more informative than any single company's disclosure. Two operators, similar equipment, similar workloads, opposite conclusions about how long the kit earns. Nobody running this infrastructure actually knows, and the ones closest to it disagree.
10
8. The waiting room
This is the section the July edition could not have written, and it changes how to read everything above.
Depreciation does not begin when a company spends the money. It begins when the asset is placed in service. Anything bought and not yet switched on sits on the balance sheet as construction in progress, contributing nothing to revenue and, importantly, nothing to the depreciation line either. In a steady state that gap is small and boring. In a build that is doubling every year, it becomes the single largest distortion in the reported numbers.
Exponential View put numbers on it on 10 August 2026, and they are larger than we expected. Across four hyperscalers it reports $315 billion of assets not yet operational, up from $281 billion just one quarter earlier. The waiting room is not merely large; it is filling faster than it empties. Alphabet's undeployed capital reached about $123 billion on that count, roughly 38 percent of its net property and equipment, having grown by $44 billion in six months. Meta's spending now takes something like 1.7 years to go live, a full year longer than it took in FY2024, and only about a third of what the company currently spends reaches service inside twelve months.
Follow that through and it cuts both ways, which is why we put it in a dossier rather than a headline.
Against the bulls: the profits being reported right now do not yet carry the depreciation of the assets being bought right now. Exponential View notes that the AI depreciation bill more than doubles each year. Every quarter of deferred deployment pushes a larger charge into a later period, and the earnings that look comfortable today are comfortable partly because the meter has not started.
Against the bears: this is a construction and supply bottleneck, not evidence of absent demand. Power connections, transformers and turbines are the constraint, and a company that could not get a substation energised is in a different position from one that built capacity nobody wanted. That distinction is precisely the one the 2001 comparison turns on, and it is the strongest thing the bulls have.
What the gap does establish, and here we are unambiguous, is that the reported returns on AI capital are not yet measurable. You cannot compute a return on assets that are not in service. Anyone quoting a clean ROI figure for the buildout, in either direction, is working with a numerator and a denominator that do not describe the same thing.
11
9. The leveraged edge
The hyperscalers get the coverage because the numbers are the largest. The leverage, though, concentrates at the edge, in the neoclouds: CoreWeave, Nebius and their peers, who rent capacity to the labs and finance the chips with debt secured against contracts.
They are the part of this market that behaves most like a credit instrument and least like a technology company, and they are where a demand wobble shows up first, because they have neither the balance sheet nor the diversified revenue to absorb one. The market appears to know it. Reviewing the sector on 15 August 2026, a16z notes that despite a good earnings season and every tailwind in the industry, CoreWeave was still down roughly 16 percent over the preceding year.
The same signal is visible in the bond market, faintly. Investors are asking more for the same paper: Meta's 6.3 percent 2056 bonds have traded to their widest spread yet, and recent long-dated technology issues have priced and then traded wider still. None of this is distress. Spreads at these levels are a long way from a credit event, and we would not read a few basis points as a forecast. It is the first evidence in three years that the buyers of this debt are negotiating.
12
10. The historical rhyme
Every observer reaches for the same analogy, and we take it seriously in both directions.
In the late 1990s equipment makers used vendor financing to help carriers build vast fibre-optic networks against a promise of endless traffic growth. When demand came in below forecast and prices fell, the heavily leveraged carriers cut spending and some went bankrupt. The parallel to a vendor-financed, debt-funded AI build is exact enough to be uncomfortable, and section 6 makes it more exact than it was a year ago.
The differences matter as much. The fibre of 2001 sat dark for years because there was no traffic; the capacity of 2026 is largely constrained by how fast it can be energised, which is a different problem with a different ending. The dot-com losers often had no revenue at all; the AI leaders have large and fast-growing revenue, whatever the losses at the frontier. Railways, another favourite, went through repeated boom and bust and still left behind an economy-transforming asset, which is a reminder that "it was a bubble" and "it was worth building" are not competing claims.
History does not tell us the outcome. It tells us where to look: at leverage, at utilisation, and at the distance between promised demand and delivered demand.
13
11. What actually breaks it
This is the sentence to keep. Heavy industry does not fail because the technology stops working. It fails when the debt outruns the demand.
The AI build will not unravel because models got worse, because they will keep getting better. It would unravel, if it did, because the revenue needed to service the borrowing arrived later or smaller than the schedule assumed, and a leveraged operator was forced to cut, and the cut propagated through a loop in which several parties are each other's customers, suppliers and shareholders at once.
Epoch's 13 August case study is the strongest argument against that reading and it should be taken seriously rather than filed as a dissent. Its finding is that capital showed up in size, at workable prices, for a borrower with a two-year operating history, and that financing is therefore unlikely to be the near-term constraint. I think that is right about supply of capital and silent about price of capital, and price is where this turns. Capital was available to Anthropic at 8.5 percent unbacked. The question that decides the next two years is what that number is in 2028, and whether revenue by then is compounding faster than it.
So our reframe holds, with a sharper edge than we gave it in July. Technology risk is low and falling. Financing risk is real, rising, and currently well-supplied. The settled question is whether AI is useful. The open one is whether the specific companies you depend on can carry the specific obligations they are taking on until the returns catch up, and whether the assets they bought get switched on in time to help.
14
12. What a business does when its infrastructure runs on debt
Most organisations reading this are not building data centres. They are renting the intelligence that runs on them, which makes the buildout someone else's balance-sheet problem and their own supply-chain risk. We are not suggesting anyone times the market. It is to notice that the AI capability your business increasingly depends on sits on top of a heavily leveraged, rapidly consolidating infrastructure, and to plan as though that introduces both price risk and continuity risk.
In practice that means four habits, and the fourth is new this quarter.
Avoid architecting the business so deeply around one provider's economics that a repricing would break you. Portability is cheap to build in at the start and expensive to retrofit, and the useful test is not whether an alternative exists but how many weeks it would take to move.
We would treat sudden, subsidised low prices as what they often are, a land-grab that may not last, and model what the same workload costs at two or three times today's rate. If the business case only works at the promotional price, it is not a business case.
Keep the value you get from AI tied to outcomes you can actually measure, so that when the market separates the durable from the speculative you are clearly on the durable side. This is the same discipline the adoption-gap dossier argues for, and it is the one that pays regardless of which way the financing question resolves.
And read your provider's capacity commitments the way you would read a supplier's order book. The deployment gap in section 8 is not an abstraction for a customer waiting on a region, a model tier or a committed-capacity contract. When a hyperscaler says capacity arrives in the second half, ask whether the constraint is chips or power, because those two answers have very different reliability.
See, understand, adopt, applied to your own dependencies: see what the infrastructure economics really are, understand where your exposure sits, then adopt in a way that survives a correction if one comes. The move is to use the cheap intelligence while it is cheap, and to build nothing load-bearing on the assumption that today's prices, or today's providers, are permanent.
15
13. What we are watching
Two of the five items on the July list fired outright inside a month, and a third moved. The depreciation-disclosure item fired when Microsoft extended its building lives on 29 July. The debt-terms item fired when spreads widened and the backstop premium became visible. The revenue-curve item moved, hard, in Anthropic's favour. The other two, a stall in the circular deals and honest enterprise return, did not move at all, and the first of those is the one whose silence should be least reassuring.
That is not a claim to foresight. It is a sign the cycle is running faster than a quarterly publishing rhythm, which is itself worth knowing if you are setting a review cadence. Updated:
The placed-in-service ratio, not the capex number. The capex headline is now the least informative figure in the sector. What we watch is how much of it is switched on, which shows up in construction-in-progress balances and in the gap between cash capital expenditure and assets entering service.
Further useful-life changes, and which assets they cover. Microsoft's building extension was defensible. A comparable extension applied to servers or accelerators would be a different signal entirely, and it would move reported earnings more than any product announcement of the same week.
The price of unbacked capital. The 275-basis-point spread between backstopped and unbacked AI compute financing is the cleanest live measure of how the market prices this risk, and whether it widens is the single most informative number available to an outsider.
Whether the labs' public listings happen, and at what price. Anthropic has signalled as early as October 2026, OpenAI is leaning towards 2027. A completed listing at or near these valuations would settle the funding question for years. A pulled or sharply repriced one would be the loudest datapoint of the cycle.
The neoclouds as the leading indicator. They carry the most leverage and the least cushion, so distress surfaces there first. Contract renewals and refinancing terms tell you more than share prices do.
Enterprise return, measured honestly. The buildout ultimately needs customers who book profit rather than usage. Our adoption-gap dossier tracks this directly, and it remains the question the whole edifice rests on.
16
14. Verification and sources
This dossier draws on live web research and a personal archive of more than 15,000 sources. Where a filing exists, the figure is taken from the filing. The notes below flag confidence and the material caveats.
| Claim | Confidence | Note |
|---|---|---|
| Alphabet Q2 2026: revenue $119.8B (+24%), cloud $24.8B (+82%), capex $44.9B, FCF −$5.9B; FY26 guidance raised to $195-205B from $180-190B | High | Reported 22 July 2026. |
| Meta Q2 2026: revenue $60.801B (+28%), capex incl. finance leases $31.08B, operating cash flow $31.86B, FCF $784M; FY26 guidance $130-145B, narrowed from $125-145B | High | Meta investor relations release, 29 July 2026; guidance quoted verbatim from that release. |
| Amazon Q2 2026: quarterly capex $54.2B vs $32.1B a year earlier; TTM FCF −$7.6B vs +$18.2B to June 2025; FY26 cash capex raised to ~$220B from ~$200B citing higher memory costs | High | Amazon Q2 2026 earnings release, 29 July 2026. |
| Microsoft Q4 FY2026: revenue $90.01B (+18%), Azure +43% and past $100B annual; useful life of office and data centre buildings extended from 15 to 25 years; 2026 capital spending plans unchanged | High | Reported 29 July 2026. The useful-life change covers buildings, not servers or accelerators; several secondary reports blurred this. |
| Epoch AI: capex ~70%/yr vs operating cash flow ~23%/yr; aggregate crossover ~Q3 2026; Oracle already, Amazon ~Q2 2026, Alphabet ~Q1 2027, Meta ~Q3 2027, Microsoft ~Q3 2028 | High on the analysis, superseded on timing | Epoch AI data insight, last updated 16 June 2026 and not refreshed for Q2 results. Epoch describes these as trend extensions, not all-things-considered forecasts. Q2 actuals put Alphabet and Meta at or through the line well ahead of the projection. |
| Seven builders expect ~$863B capex in 2026, +88% YoY, ~$550B AI-related; cash flow still funds ~two thirds of the build | Medium-high | Exponential View, 10 August 2026, from company guidance. Different scopes circulate: ~$725-760B is commonly quoted for four or five companies. Check the denominator before comparing figures. |
| Deployment gap: $315B of assets not yet operational across four hyperscalers, up from $281B a quarter earlier; Alphabet undeployed ~$123B ≈ 38% of net P&E, +$44B in six months; Meta ~1.7 years to place in service, ~one third within twelve months | Medium-high | Exponential View, 10 August 2026. The full analysis sits behind a paywall; figures here come from the accessible portion and the published charts. Worth re-verifying against 10-Q construction-in-progress lines before any figure is reused. |
| Anthropic compute financing: $4.5B unbacked at 8.5% vs ~$30B backstopped by Broadcom and Google at 5.75%; ~$50B total commitments assembled while revenue was under $9B; $35B against >1GW of Google TPUs; $15.2B against five data centres (1.43GW) | High | Epoch AI, "Will financing bottleneck AI compute? An Anthropic case study", 13 August 2026. Epoch's conclusion — that financing is unlikely to be the binding constraint — is argued against this dossier's framing and is quoted rather than adopted. |
| Anthropic: $65B Series H at $965B post-money, 28 May 2026; run-rate revenue crossed $47B; valuation $380B in February 2026; Samsung, SK Hynix and Micron as strategic chip-supply investors; confidential S-1 filed 1 June 2026 | High | Anthropic's own announcement. Run-rate revenue is an annualised monthly figure, not audited annual revenue, and the two are not interchangeable. |
| OpenAI: $122B round at $852B post-money closed 31 March 2026; Amazon $50B, Nvidia $30B, SoftBank $30B; >$3B from retail investors; confidential S-1 filed 8 June 2026 | High | Bloomberg and OpenAI's own announcement, 31 March 2026. |
| Anthropic IPO ambition of $2T or higher, possibly October 2026; would require ~$59-79B annual profit to justify on typical technology multiples | Medium | Fortune, 14 August 2026. An ambition reported ahead of a filing, not a priced offering. |
| Alphabet equity raise of $84.75B priced 2-3 June 2026, upsized from $80B, including a $40B at-the-market programme and a $10B Berkshire Hathaway private placement | High | Alphabet investor relations and the associated SEC filings. |
| AI-related debt issuance ~$570B across 2026, ~$489B issued to date; incremental annual debt 9% of capex in FY24 rising to ~32% by mid-2026 | Medium-high | Morgan Stanley and FactSet respectively. Definitions of "AI-related" vary between houses; treat as directional. |
| Amazon bonds: $37B (March 2026), at least $25B more (July 2026) | High | Verified separately in BFF Signal work; Bloomberg, PRNewswire. Note the second sale is "at least", not a final figure. |
| 1GW data centre: ~$38B capex, ~$8.5B/yr total cost of ownership; servers 60% of annual cost; GPUs 39% of capex; Nvidia ~29% of total cost; depreciation swing ~$12B/yr at a three-year chip life versus ~$7B/yr at seven | High | Epoch AI total-cost-of-ownership analysis, 2026. A sensitivity, not a forecast. |
| Server useful lives extended from 3-4 to 6 years across the sector 2020-2024; Amazon shortened a subset in 2025 at a cost of ~$700M to reported 2025 operating income while Meta extended | Medium-high | Company filings and contemporaneous analysis. The divergence between operators is the informative part. |
| Microsoft ~$300B AI capex vs ~$18B AI revenue; Anthropic ~$3 spent per $1 earned; enterprises exhausting annual AI budgets within months | Low to medium, and partly superseded | These three figures trace to a single post on X dated 22 May 2026 rather than to independent analyses. "AI revenue" is not a reported line at Microsoft. The Anthropic ratio is superseded by subsequent revenue growth and reported Q2 profitability. Retained because the underlying argument is real; attributed honestly because the sourcing is thinner than its circulation suggests. |
| OpenAI's 2026 loss | Dropped from this edition | The July edition carried "~$14B loss in 2026, roughly triple 2025". We could not stand that figure up against any audited or company-published source, and the estimates in circulation range from about $14B on a non-GAAP basis to roughly $33B on a GAAP one, which is a spread too wide to report as a number. The paragraph now describes the rate of loss by what it takes to fund rather than by a figure we cannot verify. |
| Exponential View "boom, not bubble": one of five indicators red, remainder green to amber | Opinion, well-argued | Recurring analysis, most recently 1 June 2026. A framework and a position, not a measurement. Their 10 August capex piece complicates it without retracting it. |
| CoreWeave down ~16% over the preceding year; long-dated AI-related bonds trading wider | Medium | a16z sector review, 15 August 2026, and contemporaneous bond-market reporting. Share prices and spreads move daily; these are illustrative of direction rather than levels. |
Charts labelled "BFF" are our own, drawn from the sources named beneath them. The framed figure is Epoch AI's own chart, used under its CC-BY licence and credited in the caption.
Dossier as pdf
Download this dossier
The full dossier as a pdf, with every figure and the source list. Fill in your details and the download starts right away.

Ruben Horbach
Co-founder · Back From the Future
Ruben researches how organisations adopt AI meaningfully — not as technology, but as a change in work and people. He builds the agent infrastructure behind BFF and speaks about the near future of work.